I'm Sich, a UIUX Designer

PROJECT BRIEF
KPMG AR exhibits
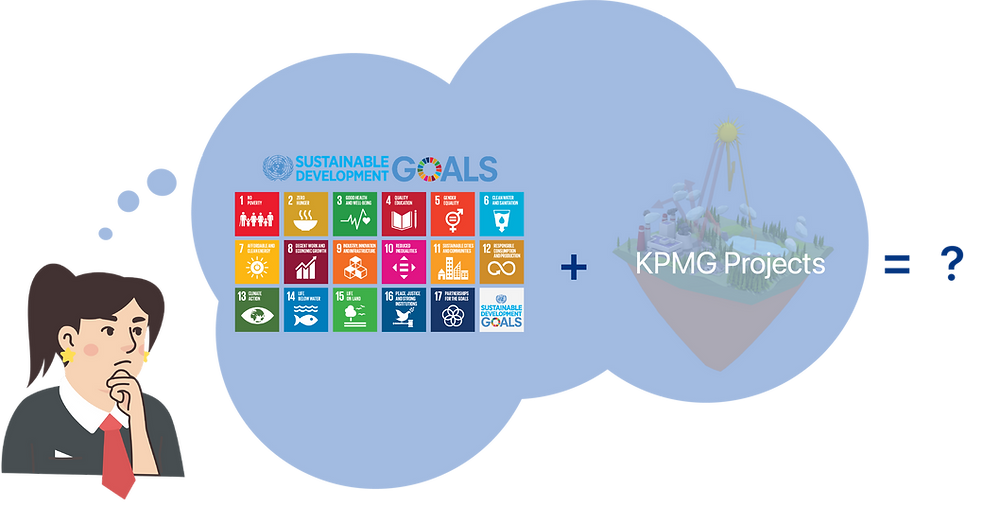
This project is an augmented reality experience that immerses the visitors of the KPMG Ignition Centre in comprehending 17 Sustainable goals through 3D models, images, videos and physical exhibits. Using their mobile phone, the user can walk around and explore the tiles throughout the office while learning more about KPMG’s take on the SDGs.
My Contribution
Durations
Software/ Tools I used
Team
UIUX
AR web design Illustration Prototype/ User testing Weekly content delivery
12 weeks
Figma
Adobe Illustrator
Adobe After Effects
HTML/CSS
Sichen Huo
Behnoosh Ashtari
Chase Schrader
Ruchika Madan
Shayan Khorsandi
Lingjie (Helena) Wan
UIUX
AR web design Illustration Prototype/ User testing Weekly content delivery
UIUX
AR web design Illustration Prototype/ User testing Weekly content delivery
Lead Product Designer 3D Artist
Project Manager
Product Manager
Developer
Product Designer

Client Background
KPMG Ignition Centre is the innovation, analytics and advanced technology centre designed to spark new thinking and fuel transformation for KPMG clients. In addition, KPMG is a signatory to the Sustainable Development Goal.

KEYWORDS
17 SDG goals
Short and Sweet
Guidance Tool
AR
CLIENT MEETINGS - 1ST WITH UX TEAM
Align initial idea with clients
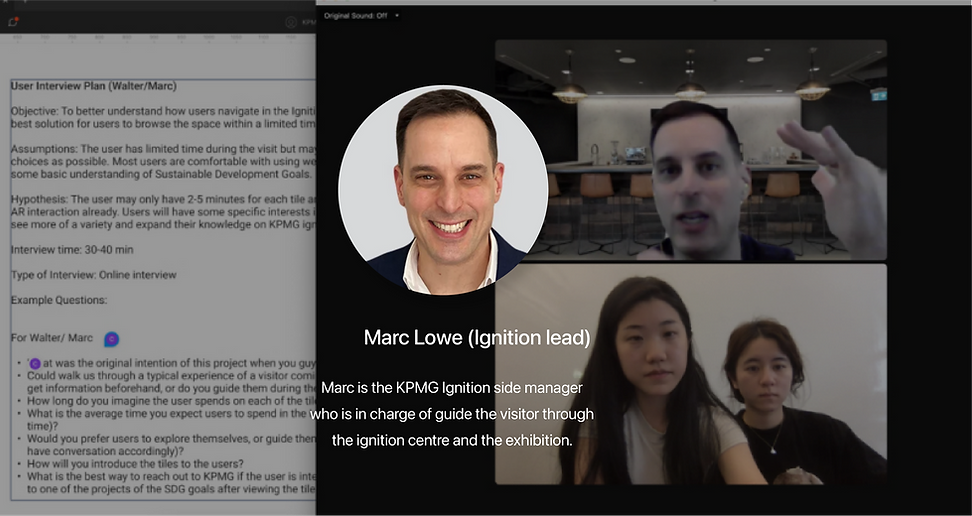
First, we interviewed Marc to align our idea to the client’s imagination and better understand how users navigate in the Ignition Center, focusing on solving the best solution for users to browse the space.
1
A more guided tour for C-level excutives
2
Web URL/QR code to start tour
3
User experience about for 2min per tile
4
Content in the tile should be short and consise
5
10-12 min for entire experience
Trade off and goals
Two initial prototypes and user flow
Personalized tour A
Personalized tour A

Need adressed
Need adressed
The route can be personalized and self-oriented based on the landing questionnaire. Allow user to browse projects only related to their interest
Idea
Users will complete a short QA for us to generate a more personalized tour that fits their business goal.
Some C-level executives wish for more direct information that fits their needs. They wish to jump straight to the point.
Client feedback
The client clarified that there will be someone leading the tour. The process is long and needs more time in the project pipeline.

Need adressed
Users can browse the projects in a shorter amount of time. It can only be used as a guide tool.
Idea
Users will complete a short QA for us to generate a more personalized tour that fits their business goal.
Some C-level executives wish for more direct information that fits their needs. They wish to jump straight to the point.
Client feedback
Better solution that A. Keep it sweet and short, as a tool for our visitor lead
Personalized guide tool B
Pain points
Creating a collection of digital exhibits within the KPMG Ignition Centre have some major problems :
How to learn to use web AR in a limited time frame during the tour
How to learn to use web AR in a limited time frame during the tour
How to align SDG goal with project information
How to combine the interface with AR experience
Solutions

Quick, intuitive Onboarding
and house made simple gif to guide user within 1 minute

Clean Information Card
with a flexible tab for users to browse through contents

Non-interrupted experience
within AR, with transparency and blur effect
PROBLEM STATEMENT
How might we create a web-based immersive expereince, which is quick to access and easy to navigate for ignition centre’s visitors especially c-level executives while focusing on UN sustainable goals?
Process & Analysis

RESEARCH
AR trend of 2022
Explore what other XR applications exist right now, and examined what is being offered in a wide range of industries. However most designs are based on an AR app and we realized that web AR cannot detect surfaces, and have many uncertainties in codes.

RESEARCH
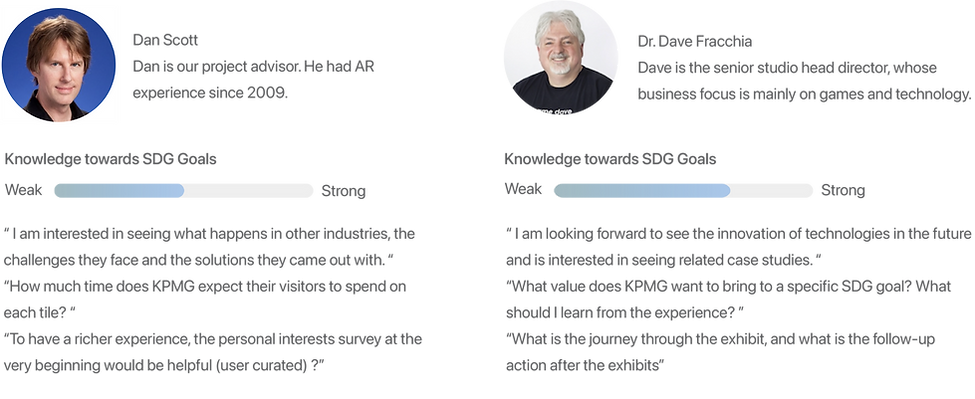
Primary research - C level staff in our network
It was difficult to arrange time talking with c-level executives of KPMG, therefore we conducted the primary research with our network. We interviewed 2 past c-level executives to understand their interet, their focus point and knowledge towards SDG goals
ANALYSIS
User persona and flow


USER TESTING
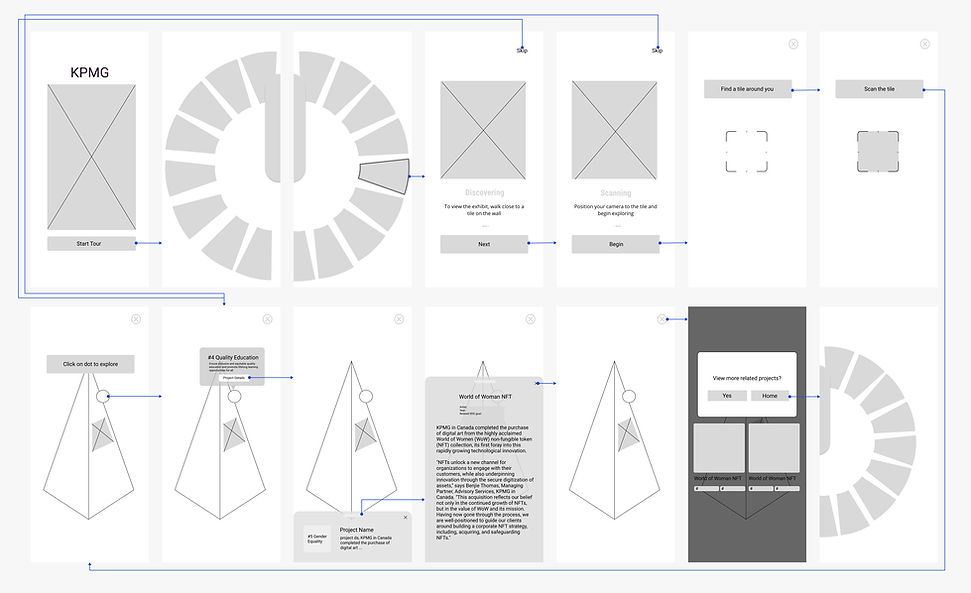
User flow and lowfi
USER TESTING
20 Internal user tests
We tested our first wireframe with 20+ people around us for testing 3 big factors: the light and dark modes, the style of the landing page (3D or 2D graphic) and the flow of the card bubble.

USER INTERFACES
The Iterations for the user test

USER INTERFACES
Mid-fi bright/dark versions


VISUAL DESIGNS
Landing gifs


Bubble card + clicking dots
